Farm Performance Center
Discover hidden opportunities to improve profitability, protect grain quality, and maximize efficiency with HTS Ag's free Farm Performance Tools.
Welcome to the HTS Ag Farm Performance Center
Every decision on your farm impacts profit. From planting and harvest to grain storage and equipment investments, small improvements can add up to significant returns.
The HTS Ag Farm Performance Center was created to help farmers make more informed, data-driven decisions throughout the growing season and beyond. Whether you're evaluating the return on a technology investment, measuring operational performance, managing stored grain, or determining the best time to run aeration fans, our tools are designed to provide practical insights you can put to work immediately.
Unlike generic online calculators, these assessments and decision-support tools are built around real-world farming practices and years of experience working alongside growers throughout Iowa and the Midwest. They are designed to help you identify opportunities, reduce risk, improve efficiency, and maximize profitability.
Most importantly, your information remains yours. Any data entered into Farm Performance Center tools is used only to provide your results and, if requested, connect you with an HTS Ag specialist. We do not sell or share your information with third parties.
Explore the tools below and discover new ways to improve performance across every acre, every harvest, and every bushel.
Measure. Analyze. Improve. That's the power of the HTS Ag Farm Performance Center.

Planter Performance Assessment
What's it worth to plant smarter?
Planting season sets the foundation for everything that follows. Even small issues with seed placement, emergence consistency, downforce, spacing, or planting speed can impact yield potential across every acre. This assessment helps benchmark your planter's performance, identify opportunities for improvement, and estimate where better planting accuracy could increase productivity and profitability. Understanding your planter's strengths and weaknesses today can help ensure you're positioned for the best possible results at harvest.
Grain Profit Protection Calculator
How much grain could be at risk?
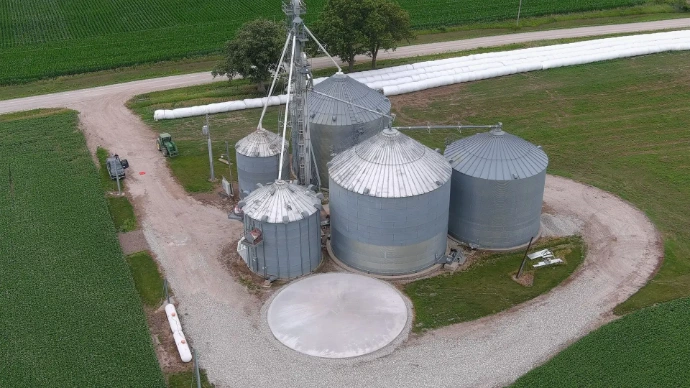
Every bushel you store carries both opportunity and risk. Moisture migration, spoilage, shrink loss, and grain quality issues can quietly reduce the value of grain in storage long before it reaches the market. This calculator helps estimate the financial impact of grain management practices by showing how improved monitoring and management may help protect grain quality, reduce losses, and preserve the value of your stored crop. A few minutes spent completing the assessment could uncover thousands of dollars in potential savings across your operation.
Harvest Performance Assessment
How are your combine and harvest tactics affecting your efficiency?
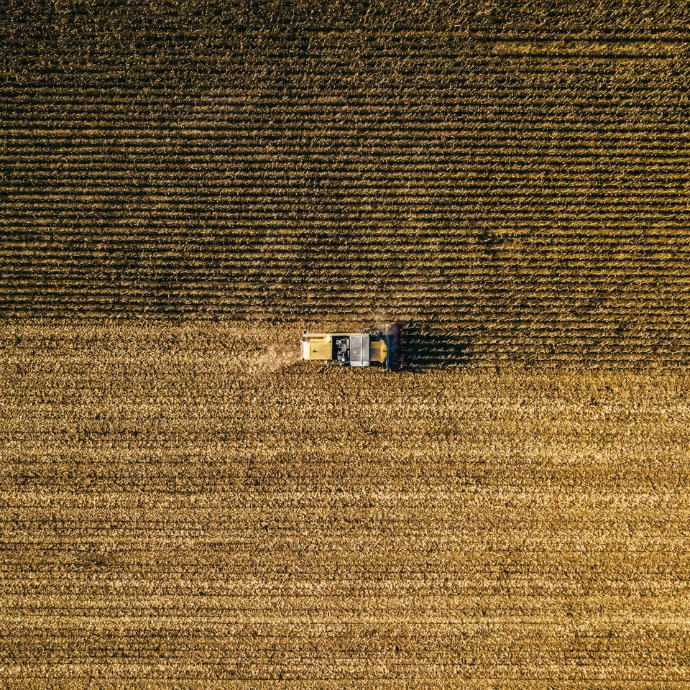
Harvest is where an entire season's investment in seed, fertilizer, technology, and management is finally measured. Even small inefficiencies in harvest capacity, machine setup, guidance, or yield data accuracy can impact profitability and decision-making. This assessment helps benchmark your current harvest operation, identify strengths, uncover potential areas for improvement, and provide practical insights to help maximize efficiency, confidence, and return on every acre you harvest.
A Valuable Tool for Every Grain Operation
Are you running your fans when you should?
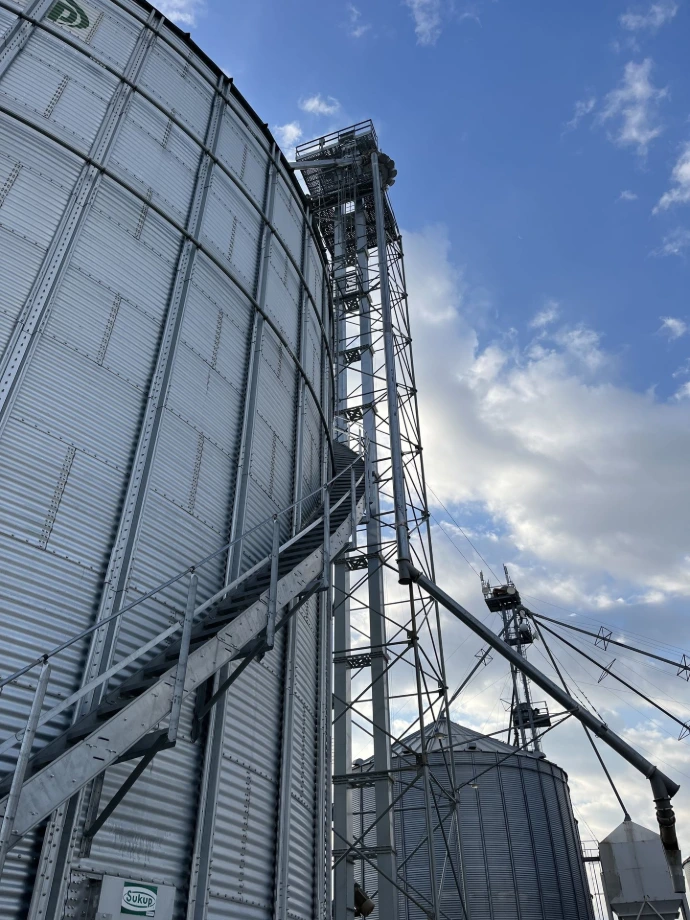
Managing grain in storage is just as important as growing it in the field. The EMC (Equilibrium Moisture Content) Calculator helps farmers determine whether current weather conditions are favorable for drying grain, maintaining grain quality, or potentially adding moisture back into the bin.
Using your real-time weather data, the tool calculates the moisture level grain will naturally move toward based on temperature and humidity. This helps farmers make smarter decisions about when to run aeration fans, reducing energy costs while protecting grain quality and marketability.
Whether you're managing corn, soybeans, or wheat, the EMC Calculator takes the guesswork out of fan management and provides valuable insights that can help reduce spoilage risk, preserve grain value, and improve the profitability of your grain storage operation.
Corn Head Guidance ROI Calculator
Are you leaving profit in the field?
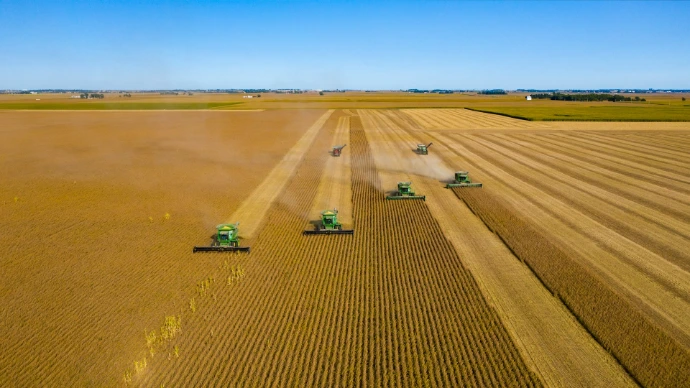
Harvest losses can add up quickly, but they're often difficult to see from the cab. The Z-Row ROI Calculator helps farmers estimate the financial impact of ear loss during harvest and determine how much value can be recovered with Ag Leader's Z-Row guidance system.
By entering a few simple details about acres, yield, corn price, and estimated harvest loss, farmers can see the potential return on investment from keeping the combine centered on the row, reducing head loss, and improving harvest efficiency.
Whether you're farming a few hundred acres or several thousand, get a data-driven look at how even small reductions in harvest loss can translate into significant savings and a faster payback. It's a simple way to evaluate one of the last opportunities each season to protect yield and maximize profitability.

Planter Technology ROI Calculator
Where in your planting could you be missing opportunities?
Quantify the value of improving planting performance with Ag Leader SeedCommand technologies such as SureDrive®, SureSpeed®, and SureForce®. Planting season offers the greatest opportunity to influence yield, and even small improvements in seed placement, spacing, emergence, and downforce management can have a significant impact on profitability at harvest.
By entering basic information about your operation, the calculator estimates potential gains from reducing skips and doubles, improving emergence consistency, maintaining proper downforce, and planting at higher speeds without sacrificing accuracy. The result is a clear picture of the economic impact these technologies can have on your farm.
Take your results and make better decisions.
HTS Ag our goal is to take every dollar you invest in technology to start paying you back the moment you start using it. Contact us today and we can help you evaluate where those dollars can make an impact.